
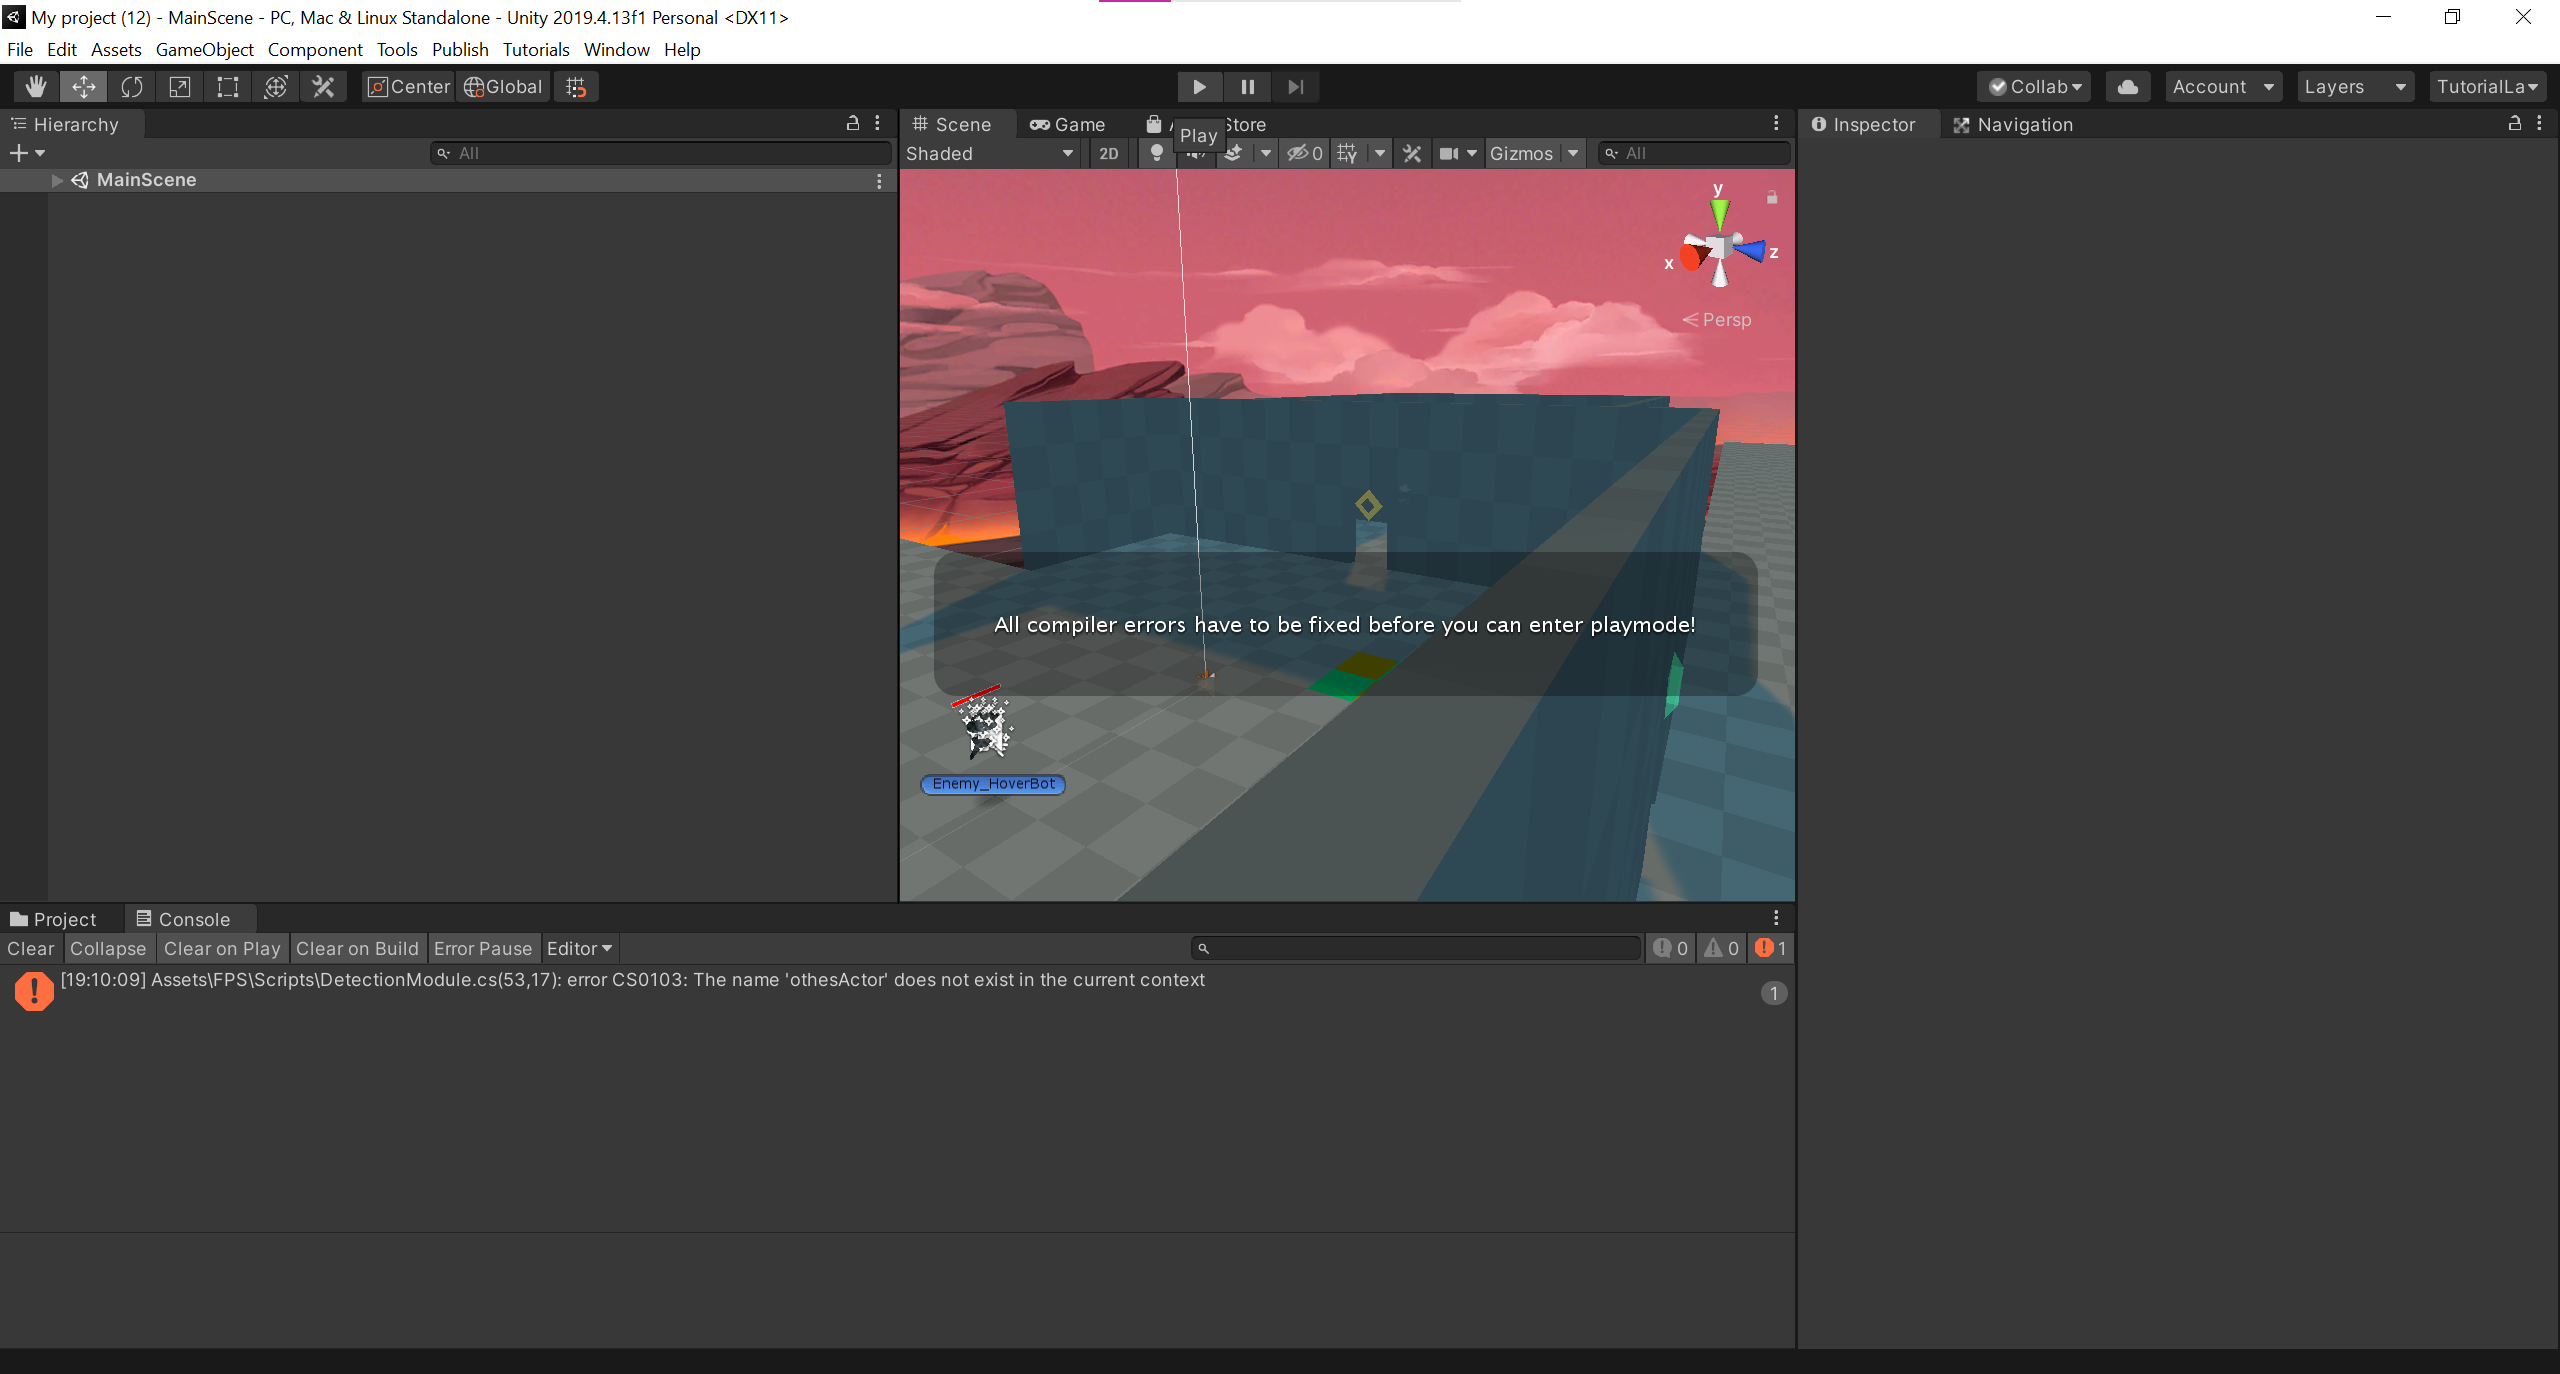
Debugging is an integral part of game development, and its importance cannot be overstated, especially when working with Unity, a popular game development engine. Debugging refers to the process of identifying, isolating, and fixing errors or bugs within a game. It plays a critical role in ensuring the quality, stability, and overall success of a game project. Let’s explore the significance of debugging in game development using Unity.
- Error Identification: Debugging helps developers identify errors in their game code. Unity provides a robust debugging environment that allows programmers to closely examine their code, set breakpoints, and step through the execution process. By observing variables, inspecting memory, and monitoring the flow of code, developers can pinpoint the exact locations and causes of errors.
- Bug Isolation: Once an error is detected, debugging assists in isolating the bug and understanding its impact on the game. Through various debugging techniques, developers can narrow down the specific conditions or actions that trigger the bug, allowing them to recreate the issue consistently. This step is crucial for understanding the root cause and developing an effective fix.
- Performance Optimization: Debugging is not limited to fixing bugs but also aids in optimizing game performance. Unity offers profiling tools that allow developers to analyze the performance of their game in real-time. By identifying performance bottlenecks, such as inefficient algorithms, excessive memory usage, or rendering issues, developers can enhance the game’s performance, resulting in smoother gameplay and improved player experience.
- Stability and Quality Assurance: Debugging plays a vital role in ensuring the stability and quality of a game. By meticulously identifying and addressing bugs, crashes, or unexpected behavior, developers can prevent issues that may frustrate players or compromise the game’s integrity. Robust debugging practices contribute to a more stable, reliable, and polished game, minimizing the chances of negative reviews or customer dissatisfaction.
- Iterative Development: Debugging facilitates the iterative development process, which is a hallmark of game development. As developers continuously add features, mechanics, and content to a game, new bugs or conflicts may arise. Effective debugging enables developers to quickly identify and fix these issues, allowing for rapid prototyping, testing, and iteration. It helps maintain a smooth development workflow and promotes efficient collaboration among team members.
- User Experience: Debugging directly impacts the overall user experience of a game. By resolving bugs and ensuring smooth gameplay, developers can create an immersive and enjoyable experience for players. Debugging allows for thorough playtesting, enabling developers to gather feedback, identify pain points, and address any issues that may hinder player engagement or satisfaction.
- Long-Term Maintenance: Debugging is not limited to the initial development phase but also extends to long-term maintenance and updates. As games evolve and new features are added, existing code may require modifications or optimizations. Robust debugging practices provide a foundation for ongoing maintenance, allowing developers to quickly identify and fix issues introduced during updates, ensuring the game’s longevity.
In conclusion, debugging holds immense importance in game development, particularly when working with Unity. It facilitates error identification, bug isolation, performance optimization, stability assurance, iterative development, enhanced user experience, and long-term maintenance. By investing time and effort into effective debugging practices, developers can create high-quality, polished games that captivate players and stand the test of time.
Basic Debugging Techniques in Unity
When it comes to debugging in Unity, there are several fundamental techniques that can help developers effectively identify and fix issues in their game code. These techniques serve as a starting point for troubleshooting and provide a solid foundation for more advanced debugging practices. Here are some basic debugging techniques in Unity:
- Debug.Log Statements: Debug.Log is a simple yet powerful debugging tool provided by Unity. By inserting Debug.Log statements in strategic locations within the code, developers can print messages to the Unity console during runtime. These messages can help track the flow of execution, display the values of variables, and provide insights into the game’s behavior. Debug.Log statements are particularly useful for verifying if certain conditions are met or determining the values of variables at specific points in the code.
Example:
Debug.Log("Entering Update() function.");
int score = 10;
Debug.Log("Current score: " + score);
- Breakpoints: Breakpoints allow developers to pause the execution of their code at specific lines for closer inspection. Unity’s integrated development environment (IDE), such as Visual Studio or Rider, supports breakpoints. By setting a breakpoint, developers can halt the program’s execution, examine the state of variables, step through the code line by line, and identify the source of an issue. Breakpoints are particularly useful for investigating complex bugs or understanding the flow of code in detail.
- Inspector Debugging: Unity’s Inspector window provides a visual representation of game objects and their associated components. During runtime, developers can inspect and modify the values of variables directly from the Inspector window. By monitoring and adjusting variables in real-time, developers can identify discrepancies or unexpected behaviors. Inspector debugging is especially useful for examining the state of objects, verifying values, or pinpointing issues related to specific components or properties.
- Stack Traces: When an error or exception occurs in Unity, a stack trace is generated. Stack traces provide a detailed report of the function calls that led to the error, allowing developers to trace the sequence of events and identify the problematic code. By examining the stack trace, developers can understand the call hierarchy, locate the specific line where the error occurred, and gather valuable information about the runtime context. Stack traces are crucial for diagnosing exceptions and runtime errors.
- Unity Profiler: The Unity Profiler is a powerful built-in tool for performance analysis and optimization. It helps identify bottlenecks, excessive resource usage, or inefficient code in real-time. The Profiler provides detailed insights into CPU usage, GPU performance, memory allocation, and more. By analyzing the Profiler data, developers can detect performance issues and make informed optimizations to enhance the game’s performance.
- Conditional Compilation: Unity supports conditional compilation directives that enable developers to selectively execute specific sections of code based on predefined conditions. By strategically using conditional compilation, developers can isolate problematic code, test alternative implementations, or focus on specific scenarios. This technique is particularly useful when dealing with platform-specific issues or implementing different behavior for debugging purposes.
Example:
#if DEBUG_MODE
    Debug.Log("Debug mode enabled!");
#endif
These basic debugging techniques provide developers with effective starting points for identifying and resolving issues in their Unity projects. By utilizing these tools and practices, developers can gain better visibility into their code, isolate bugs, optimize performance, and ensure a smoother gameplay experience for players.
Unity’s Debugging Tools
Unity provides a range of debugging tools and features that are specifically designed to aid developers in identifying and resolving issues within their game projects. These tools offer comprehensive support for debugging and provide valuable insights into the game’s behavior, performance, and runtime data. Let’s explore some of Unity’s key debugging tools:
- Unity Console: The Unity Console is a fundamental debugging tool that displays messages, warnings, and errors generated during runtime. Developers can use the Debug.Log, Debug.LogWarning, and Debug.LogError functions to print messages to the console, allowing them to track the flow of execution, monitor variable values, and identify potential issues. The console also provides filtering and search functionality, making it easier to locate specific messages.
- Inspector Window: The Inspector window is a versatile debugging tool that allows developers to inspect and modify the properties and variables of game objects and components. During runtime, developers can observe the real-time values of variables, tweak settings, and verify that objects and components are behaving as expected. The Inspector window is particularly useful for debugging issues related to specific objects, components, or properties.
- Breakpoints and Stepping: Unity integrates with popular development environments like Visual Studio and Rider, providing powerful debugging capabilities. Developers can set breakpoints at specific lines of code, which pause the execution of the game and allow for in-depth analysis. While paused, developers can inspect variables, step through the code line by line, and examine the call stack. This feature enables precise debugging, helping identify the root cause of issues.
- Unity Profiler: The Unity Profiler is a robust performance analysis tool that helps optimize the game’s performance and identify bottlenecks. It provides detailed information about CPU usage, GPU performance, memory allocation, and rendering statistics. Developers can use the Profiler to measure and analyze performance data in real-time or over a specific period. It assists in detecting performance issues and allows for targeted optimizations to enhance the game’s overall performance.
- Frame Debugger: The Frame Debugger is a specialized tool for debugging rendering-related issues in Unity. It allows developers to step through the rendering pipeline and observe the rendering process frame by frame. The Frame Debugger provides insights into shaders, textures, draw calls, and other rendering aspects, making it invaluable for identifying graphical anomalies or performance-related problems.
- Unity Remote: Unity Remote is a mobile app that facilitates debugging and testing of Unity games directly on mobile devices. It allows developers to connect their mobile devices to the Unity Editor, enabling real-time testing and debugging without the need for constant builds and deployments. Unity Remote aids in debugging mobile-specific issues, optimizing touch input, and ensuring the game works as intended on different devices.
- Profiler Modules: Unity’s Profiler offers additional modules that provide specialized insights into specific areas of the game. These modules include the Physics Profiler, Audio Profiler, UI Profiler, and Network Profiler. Each module focuses on a specific aspect of the game’s performance and provides detailed information and metrics related to that area. Developers can leverage these modules to pinpoint issues and optimize specific subsystems within their game.
By leveraging Unity’s robust debugging tools and features, developers can effectively identify, isolate, and fix issues within their game projects. These tools provide valuable insights, aid in performance optimization, and enhance the overall development workflow, resulting in high-quality, stable games that deliver an immersive experience for players.
Advanced Debugging Techniques
Advanced debugging techniques in Unity go beyond the basic methods and provide developers with more sophisticated tools and approaches to identify and resolve complex issues. These techniques are especially useful when dealing with challenging bugs, performance bottlenecks, or intricate system interactions. Let’s delve into some advanced debugging techniques in Unity:
- Conditional Breakpoints: In addition to setting breakpoints at specific lines of code, Unity’s debugging environment supports conditional breakpoints. Developers can set conditions on breakpoints, allowing the program to pause only when specific conditions are met. This technique is valuable when investigating issues that occur under certain circumstances or when tracking down elusive bugs that are difficult to reproduce consistently.
- Debugging Draw Calls: Unity’s rendering pipeline can be intricate, and debugging rendering-related issues requires specialized tools. Unity provides the “Debug.Draw” family of functions, such as Debug.DrawLine or Debug.DrawRay, which allow developers to visually draw lines, rays, or shapes in the Scene view during runtime. These functions help debug complex spatial relationships, visualize trajectories, or verify the placement of objects and colliders.
- Scriptable Render Pipeline (SRP) Debugging: For projects that utilize custom Scriptable Render Pipelines, Unity offers tools to debug and profile the rendering process. Developers can use the SRP Debugger to examine and analyze the rendering pipeline’s various stages, including shader execution, render targets, and post-processing effects. This tool enables in-depth inspection of custom rendering pipelines and assists in identifying rendering-related issues.
- Remote Debugging: Unity supports remote debugging, allowing developers to connect to a running game instance on a different machine or device for debugging purposes. This technique is useful when troubleshooting issues that are specific to certain hardware configurations or network interactions. Remote debugging facilitates real-time analysis and debugging on remote devices without the need for frequent builds and deployments.
- Debugging Performance Issues: Unity provides advanced profiling tools, such as the Unity Profiler and Frame Debugger, for in-depth performance analysis. These tools help identify CPU and GPU bottlenecks, excessive memory usage, inefficient code, or other performance-related issues. Developers can use these profiling tools to measure and optimize specific areas of their game, ensuring optimal performance and a smooth gameplay experience.
- Debugging Multiplayer and Networking: When working on multiplayer games or networked systems, debugging can be challenging due to the distributed nature of the interactions. Unity offers tools like the Network Profiler and the Unity Transport Package to assist with debugging multiplayer and networking-related issues. These tools provide insights into network traffic, latency, packet loss, and synchronization problems, allowing developers to diagnose and resolve multiplayer-specific bugs effectively.
- Custom Debugging Tools: In complex projects, developers may find it beneficial to create custom debugging tools or visualizations tailored to their specific needs. Unity’s extensibility allows developers to build custom inspectors, debug windows, or visualizations using the Unity Editor’s API. These tools can help monitor internal states, visualize complex data structures, or simulate specific scenarios, enabling developers to gain deeper insights into their game’s behavior.
By utilizing these advanced debugging techniques, developers can tackle complex issues, optimize performance, debug multiplayer interactions, and gain a deeper understanding of their game’s systems. These techniques empower developers to resolve intricate bugs, improve the overall quality of their games, and deliver a polished and stable experience to players.
Best Practices for Debugging in Unity
Debugging in Unity can be a complex and time-consuming process, but following best practices can streamline the workflow and make it more efficient. By adopting these best practices, developers can effectively identify and resolve issues in their Unity projects. Here are some key best practices for debugging in Unity:
- Reproducible Test Cases: Creating reproducible test cases is essential for effective debugging. Instead of relying on random occurrences of bugs, strive to isolate the conditions that trigger the issue consistently. By identifying specific steps or scenarios that lead to the bug, developers can reproduce it reliably, which is crucial for effective debugging and verifying the effectiveness of fixes.
- Version Control: Utilizing a version control system, such as Git, is essential for maintaining a reliable codebase and facilitating efficient debugging. Regularly commit your code changes to a version control repository, create meaningful commit messages, and utilize branching and tagging strategies. Version control not only provides a safety net to roll back changes but also helps track and analyze code modifications, making it easier to identify the source of bugs or regressions.
- Incremental Development and Testing: Debugging is more manageable when issues are caught early in the development process. Adopting an incremental development and testing approach helps identify and fix bugs sooner rather than later. Regularly test small portions of code, verify functionality, and address any issues immediately. This practice minimizes the accumulation of bugs and reduces the complexity of debugging later stages of development.
- Logging and Diagnostic Messages: Incorporating logging and diagnostic messages into the codebase is invaluable for understanding the game’s behavior during runtime. Utilize Unity’s Debug.Log, Debug.LogWarning, and Debug.LogError functions strategically to output relevant information to the console. Include contextual details, variable values, and timestamps in the messages to aid in identifying the flow of execution and potential problem areas.
- Use Assertions: Assertions are statements that validate certain conditions and halt the program’s execution if those conditions are not met. Unity’s Assert class provides convenient methods to include assertions in the codebase. Incorporating assertions can help catch logic errors, unexpected states, or assumptions that prove false. Assertions are particularly useful during development and testing phases to quickly identify and address critical issues.
- Divide and Conquer: When dealing with complex bugs, it is often beneficial to divide the problem into smaller, more manageable parts. Narrow down the scope of investigation by isolating specific modules, components, or systems. Temporarily disable or simplify certain functionality to pinpoint the source of the issue. By reducing complexity, developers can focus their efforts on a specific area and effectively identify the root cause of the problem.
- Use Unity’s Debugging Tools: Unity provides a wide array of built-in debugging tools, such as the Unity Console, Inspector window, Profiler, and Frame Debugger. Familiarize yourself with these tools and leverage them to their fullest extent. Learn to interpret the information provided by these tools to gain valuable insights into the game’s behavior, performance, and rendering pipeline.
- Collaboration and Code Review: Debugging can be a collaborative effort. Engage with your team members or seek help from the Unity community when encountering challenging issues. Conduct code reviews to gain fresh perspectives and catch potential bugs or oversights. Collaborating and seeking input from others can often lead to breakthroughs and accelerate the debugging process.
- Document Bugs and Fixes: Maintain a comprehensive record of bugs encountered, including their descriptions, reproduction steps, and solutions. Documenting bugs and fixes helps track recurring issues, build a knowledge base, and prevent the reintroduction of resolved bugs. This practice promotes efficient debugging in the long run and aids in onboarding new team members.
- Continuous Testing: Debugging is an ongoing process that continues throughout the development lifecycle. Regularly test and debug your codebase as new features are added or modifications are made. Implement automated testing frameworks or unit tests to catch regressions and ensure that existing functionality remains intact. Continuous testing reduces the accumulation of bugs and provides early detection of issues.
By following these best practices, developers can streamline the debugging process, identify issues efficiently, and maintain a stable and high-quality Unity project. Debugging is an integral part of the development cycle, and adopting these practices helps ensure a smoother workflow and enhances the overall reliability of the game.
Conclusion
Debugging is a crucial aspect of game development in Unity. It is the process of identifying and resolving issues within the codebase to create stable, functional, and high-quality games. Throughout the development cycle, developers rely on various debugging techniques and tools to track down bugs, optimize performance, and ensure a smooth gameplay experience.
From basic techniques like using Debug.Log statements and breakpoints to more advanced practices such as remote debugging and custom debugging tools, Unity offers a comprehensive set of tools and features to assist developers in their debugging endeavors. These tools, including the Unity Console, Inspector window, Profiler, and Frame Debugger, provide valuable insights into the game’s behavior, performance, rendering pipeline, and network interactions.
Adhering to best practices further enhances the effectiveness of debugging in Unity. Creating reproducible test cases, utilizing version control, implementing incremental development and testing, incorporating logging and diagnostic messages, and practicing collaboration and code review all contribute to a more efficient debugging process. Additionally, dividing complex problems into smaller parts and continuous testing help catch issues early and ensure ongoing stability.
Debugging in Unity requires patience, persistence, and a systematic approach. It is an iterative process that involves identifying, isolating, and resolving issues step by step. Through careful analysis, collaboration, and leveraging the debugging tools and techniques available, developers can successfully overcome challenges, optimize performance, and deliver polished games to players.
By embracing the importance of debugging, adopting best practices, and leveraging Unity’s debugging tools, developers can ensure a smoother development process, minimize the impact of bugs on gameplay, and create memorable and enjoyable gaming experiences. Debugging in Unity is not just about fixing issues; it is an integral part of the journey toward creating exceptional games.